The Point In Time Results Repository was created to assist regions with compiling count information from multiple sources, by providing an alternate means to get PIT results into the Point in Time Results File Format. To use this tool, simply enter the results from your Point in Time report into this tool. Once done, click "Export Results" and this will generate a file that is in the proper format.
The "Compile Results" feature within the Regional Command Center uses a common Point in Time Results File Exchange Format to produce a PIT report for submission to HUD. Examples of data sources that can have data compiled with this feature include:
- Unsheltered PIT count results gathered using Counting Us.
- Sheltered PIT count results from the region's Homeless Management Information System (HMIS).
- Sheltered PIT count results from providers that do not use HMIS but use Counting Us for the PIT count.
- Street Outreach data gathered from the Show The Way mobile app.
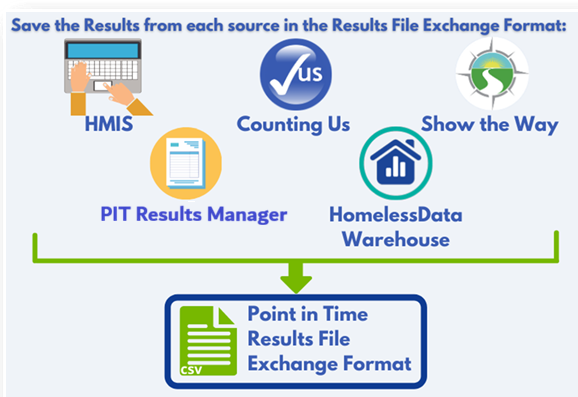 |
PIT Results Manager
The PIT Results Manager is used to help consolidate all PIT data from different data sources into a single database. Clicking 'Export Results' on the PIT Report in the Regional Command Center will create a CSV file that can be uploaded to this repo. For other data sources, admins can input the data manually via the 'Data Entry' tab which has the option to be broken down by regions that were created in the Command Center.
 |
After entering all the data, admins can export all of the results into a common data format for other data analysis if they choose.
Submit the Report to HUD
You will need to log into HUD HDX to submit the official Point in Time and Housing Inventory Chart information for your region.